Designing with Systems
Speedster
A mobile app designed to show drivers how much time they actually save by speeding. By visualizing trip data and competition with friends, the app not only reduces bad habits, but also gives users a reason to drive the speed limit.
Problem statement
Drivers lack clear, real-time feedback on how little time speeding actually saves. This results in repeated unsafe driving behavior driven by false assumptions.
Research
Research Finding & Design Insight
Research Finding
Design Insight
Drivers consistently overestimate the time saved by speeding, often believing it saves significantly more time.
AAA Foundation for Traffic Safety
Show real-time calculations or breakdowns so users understand the reality of how much time they save.
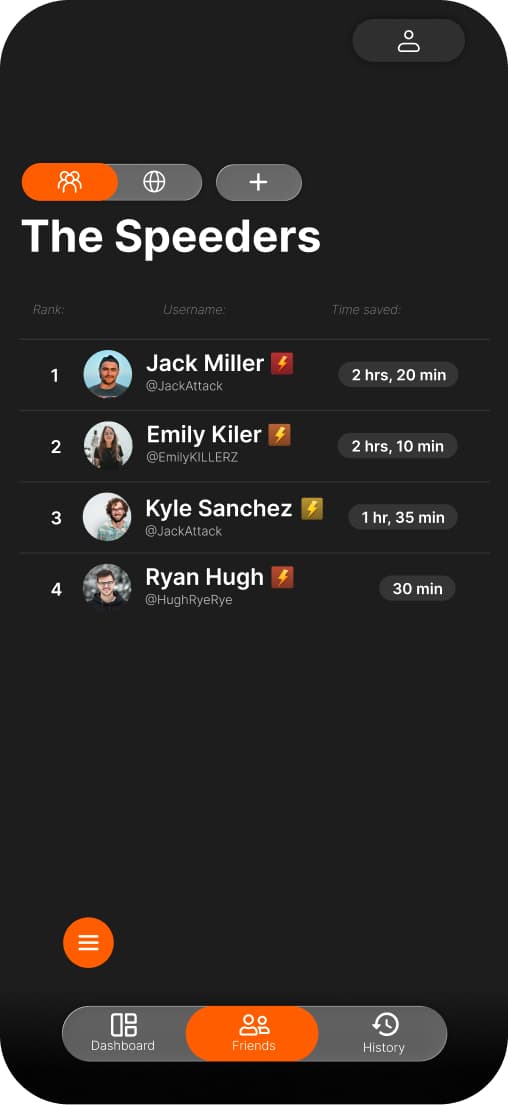
Gamification elements such as points, leaderboards, and feedback significantly improve user engagement with behavioral tracking systems.
Deterding et al., Gamification Research
Leaderboards, friendly competitions, and rankings can transform passive data to be more interactive for users.
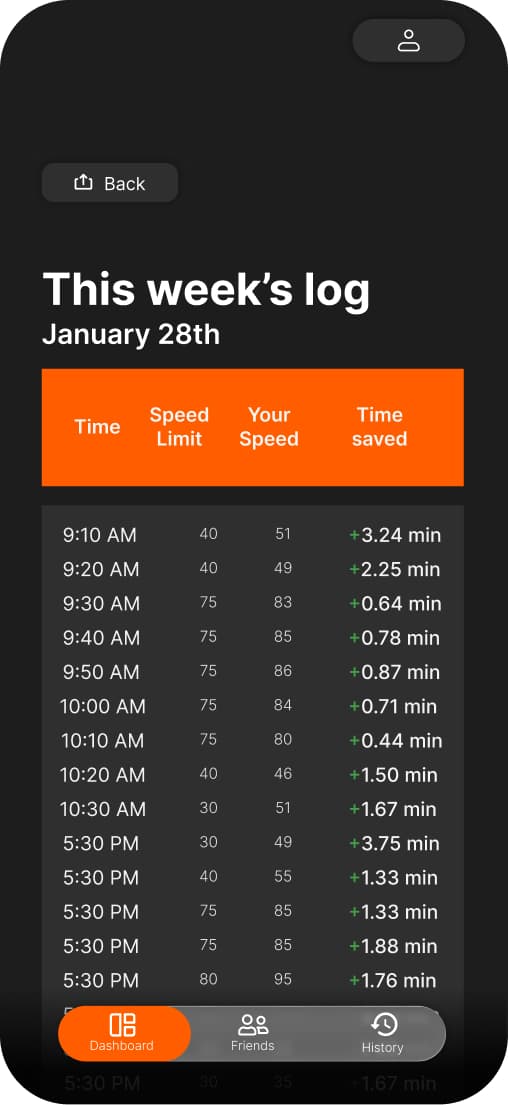
Exceeding the speed limit by 5-10 mph typically saves only a few minutes over a 30-minute trip.
U.S. Department of Transportation, Federal Highway Administration
Core app goal should be to emphasize actual time saved over perceived time saved.
BIG RESEARCH TAKEAWAY
Gamification can be used for gambling, fueling addiction, and pure profit.
Have ethics.
Have morals.
Use it to help,
Not hurt.
COMPETITOR ANALYSIS

Waze
NAVIGATION
Apps like Waze, Google Maps, Apple Maps, and Sygic GPS Navigation focus on fastest routes and ETA optimization, often reinforcing the idea that getting there quicker is the priority.

Speed Radar
AVOIDANCE
Apps like Speed Camera Radar, Radarbot, and Escort Live focus on alerting drivers to enforcement zones and speed traps, helping them avoid tickets rather than change their driving behavior.

Speedometer
BASIC STRUCTURE
Apps like Speedometer, Ulysse Speedometer, and HUDWAY Go track real-time speed data, but lack context around how speed impacts time saved or driving decisions.

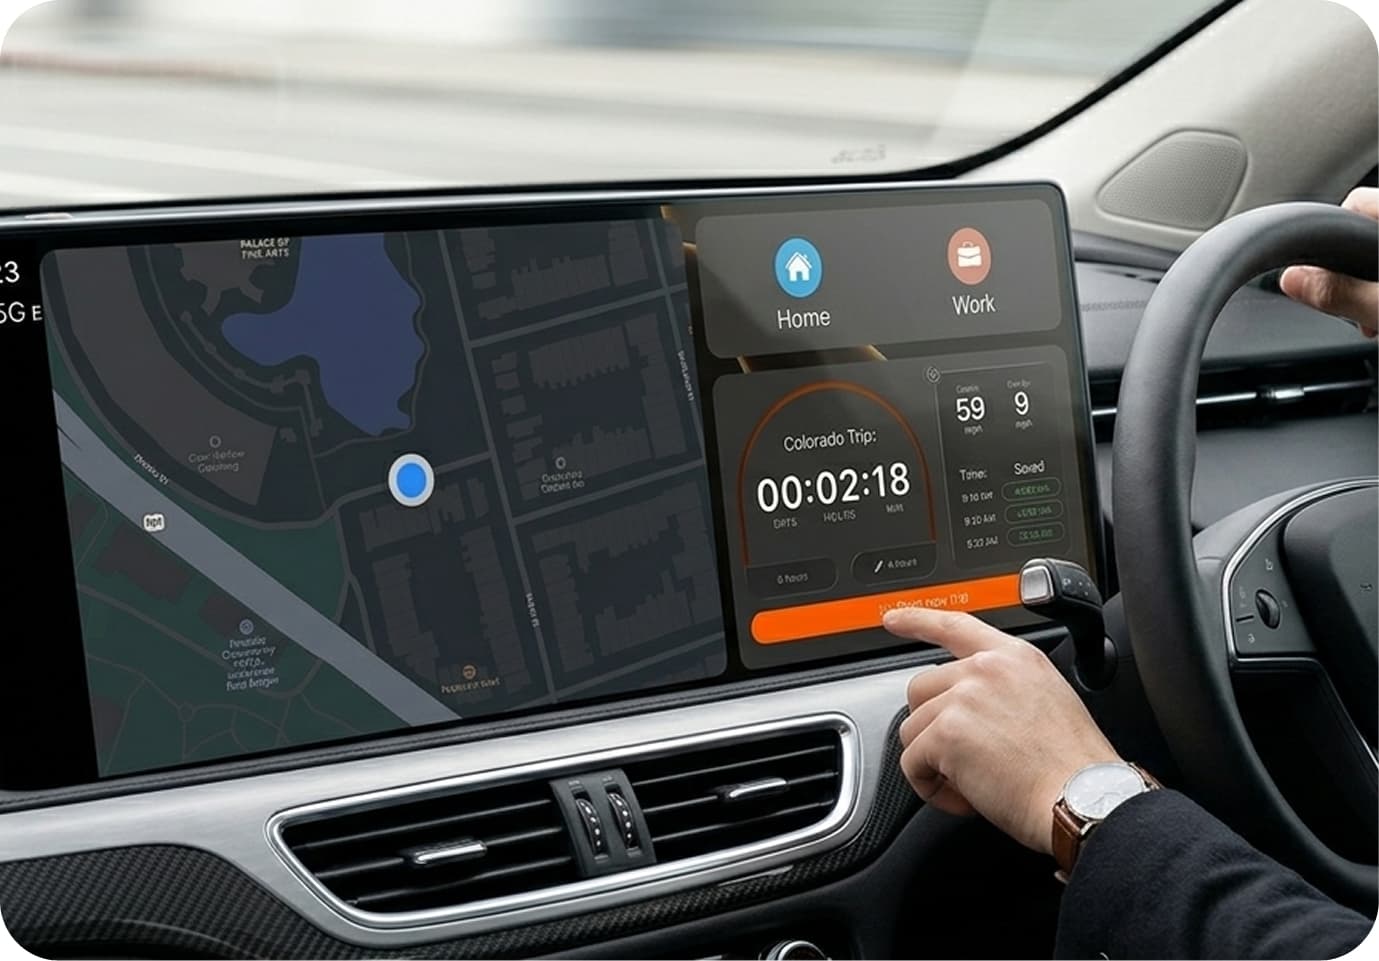
Speedster
EVALUATION
Speedster focuses on exposing the reality of speeding. Showing drivers how time saved is often negligible, shifting the mindset from "faster is better" to "it's just not worth it."
Waze
NAVIGATION
Apps like Waze, Google Maps, Apple Maps, and Sygic GPS Navigation focus on fastest routes and ETA optimization, often reinforcing the idea that getting there quicker is the priority.
Speed Radar
AVOIDANCE
Apps like Speed Camera Radar, Radarbot, and Escort Live focus on alerting drivers to enforcement zones and speed traps, helping them avoid tickets rather than change their driving behavior.
Speedometer
BASIC STRUCTURE
Apps like Speedometer, Ulysse Speedometer, and HUDWAY Go track real-time speed data, but lack context around how speed impacts time saved or driving decisions.
Speedster
EVALUATION
Speedster focuses on exposing the reality of speeding. Showing drivers how time saved is often negligible, shifting the mindset from "faster is better" to "it's just not worth it."
Planning
Wireframes
Creation and organization
Design System
Combining alike colors, font size, buttons sizes for brand and app consistency across screens.
Colors
Type
Big title
Title
Subhead
Body Bold
Body
Details
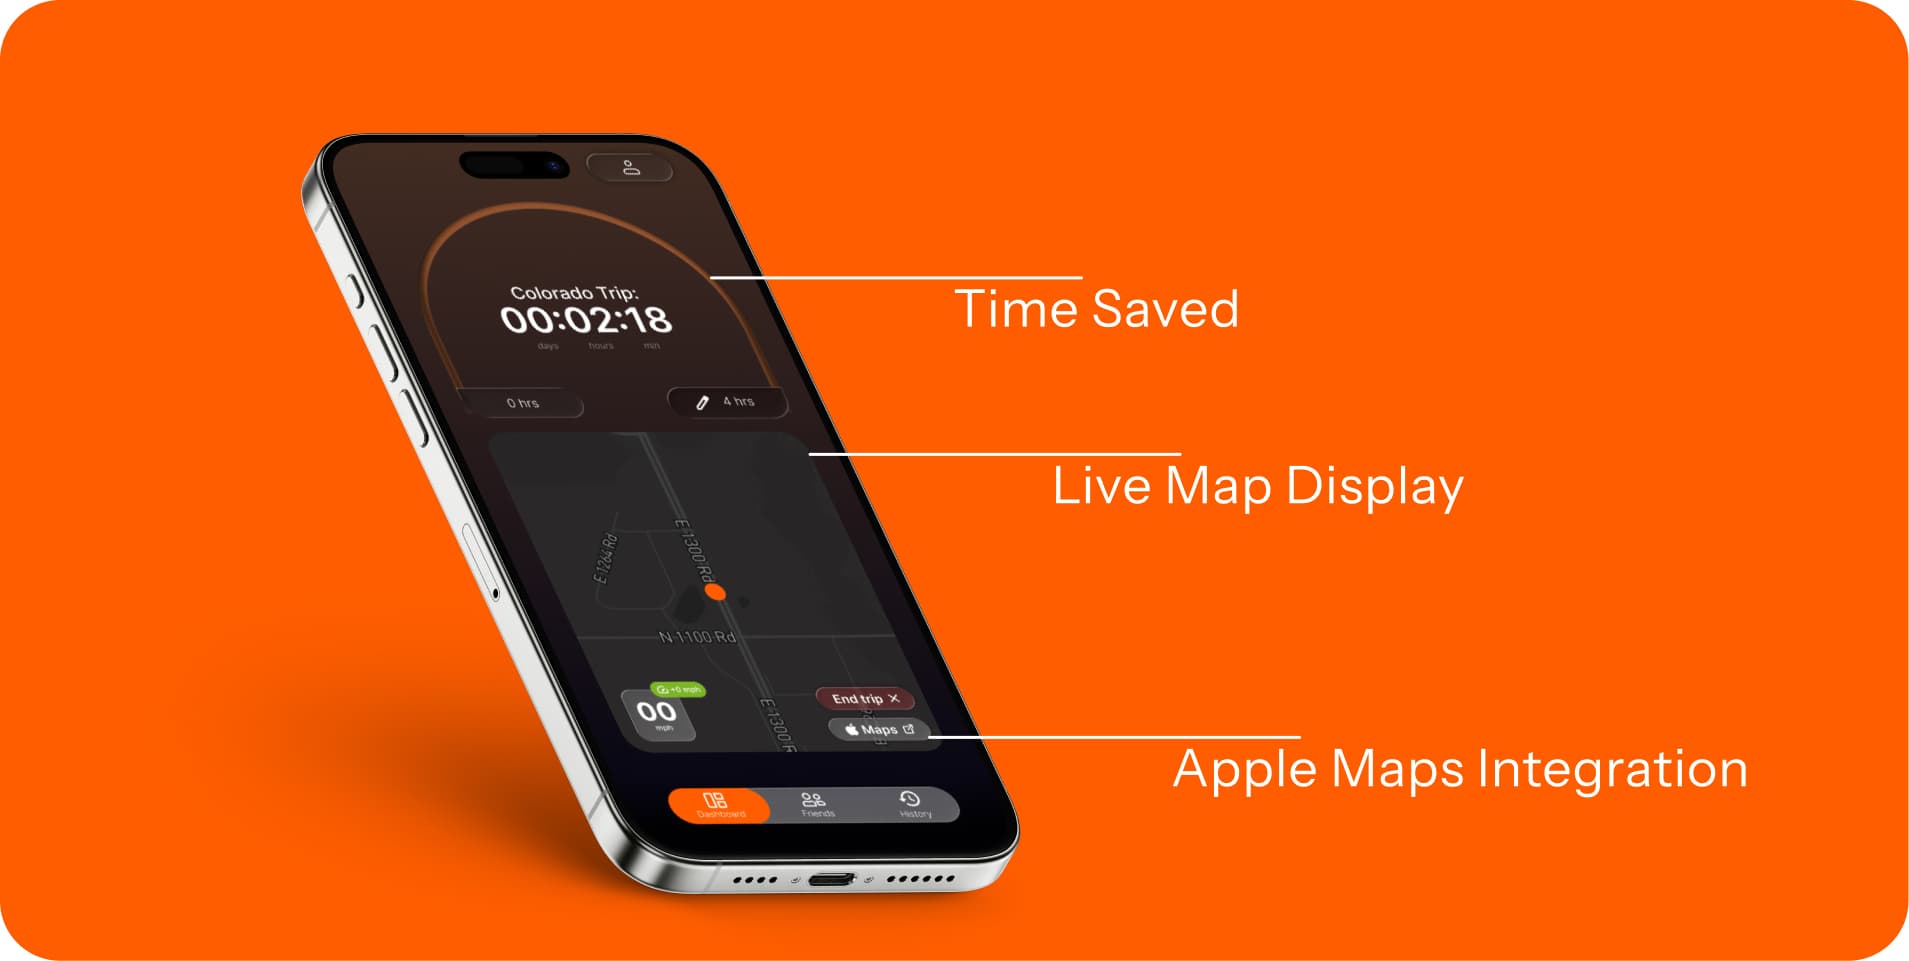
Widgets
Buttons
FINAL — DEMO VIDEO
Full Prototype
Cleaning up design aspects and ensure consistency between screens. Implementing final components and styles.
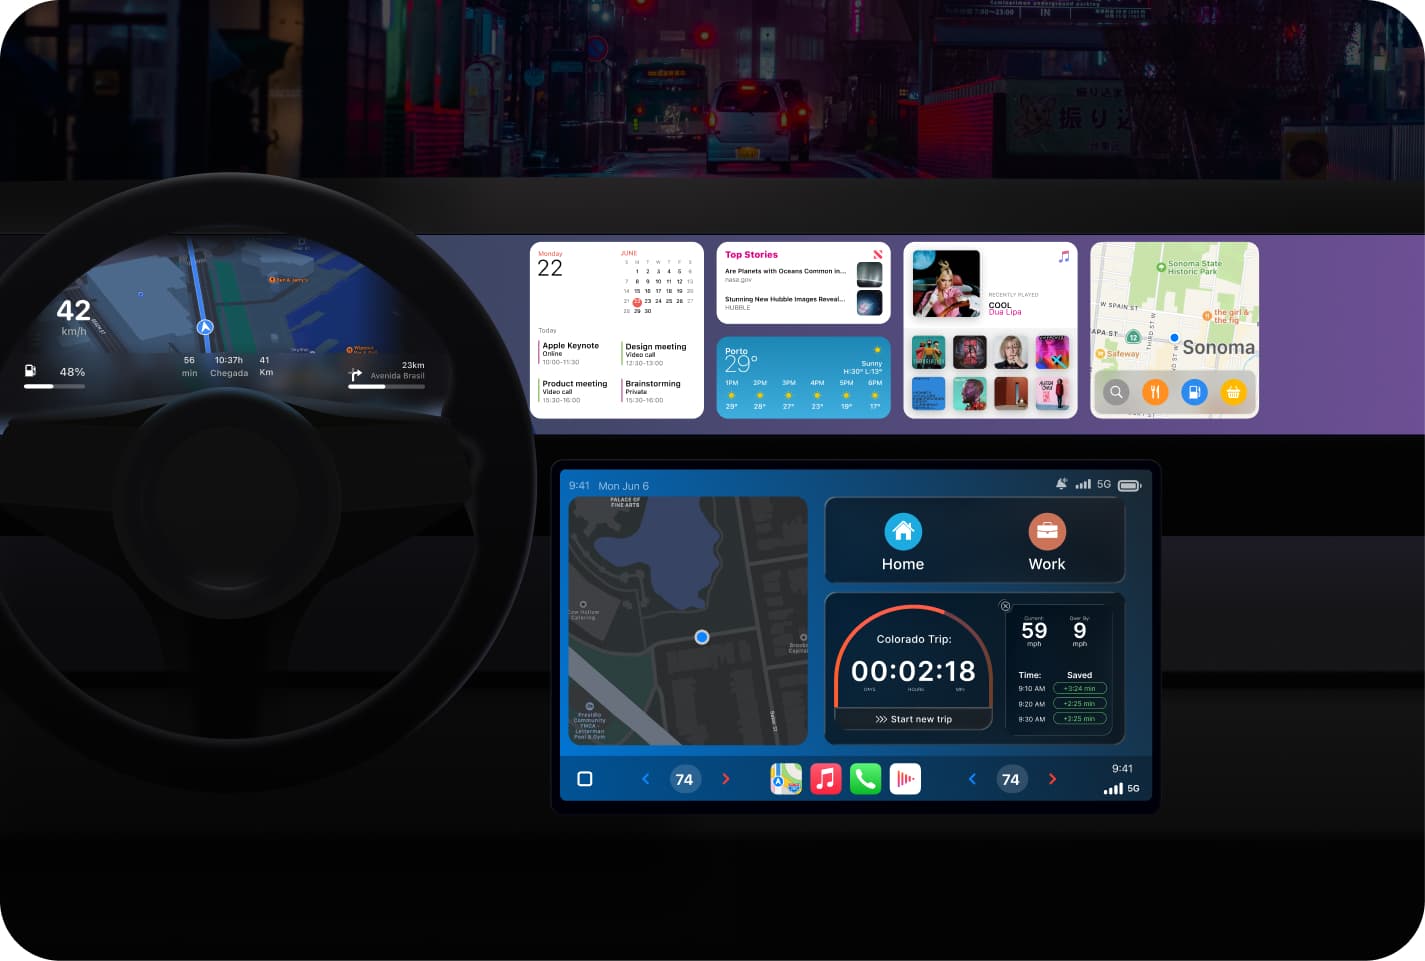
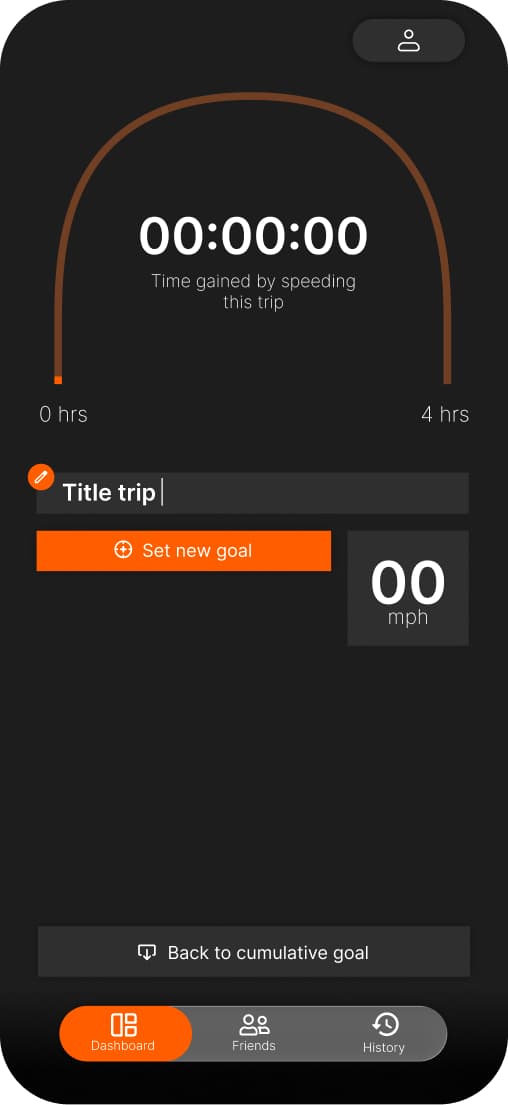
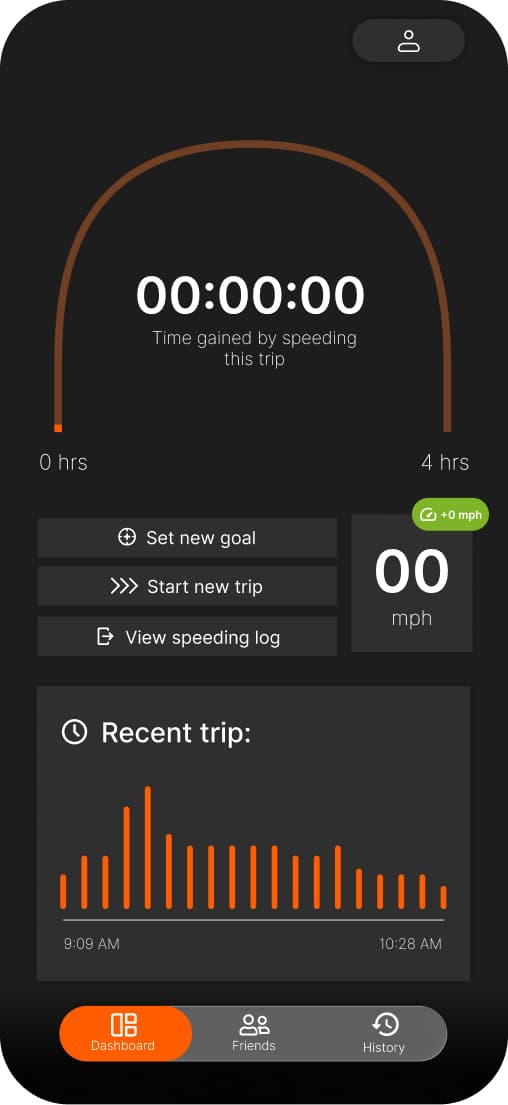
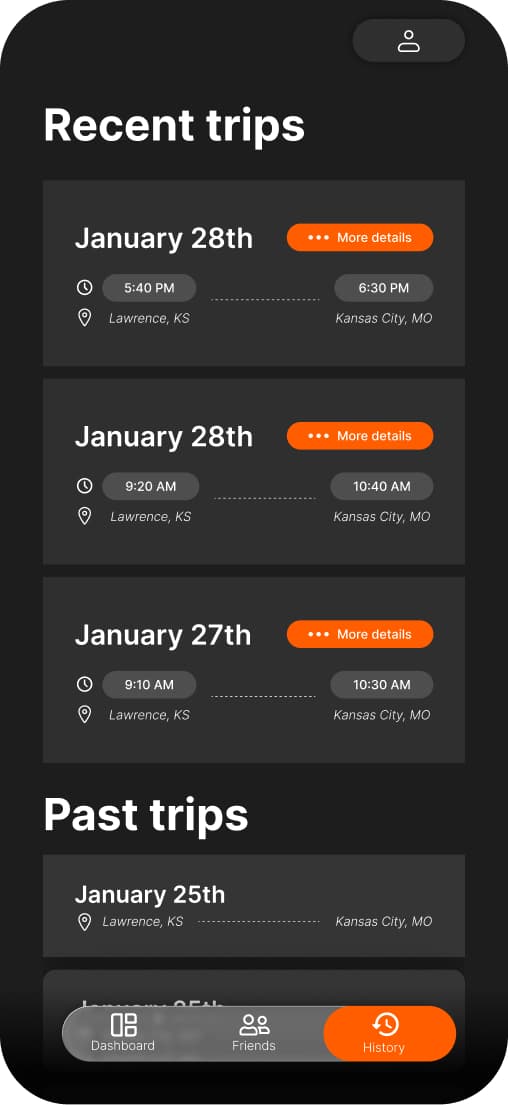
Speedster Final
Final Prototype
The final prototype of Speedster demonstrates how real-time driving data can be transformed into a playful, interactive experience that encourages safer driving behavior. By combining gamification with clear visual feedback, the app makes hidden speeding habits visible and motivates users to stay more aware of their speed on the road.