Designing with Systems
StudySync
A productivity app that is focused on students' success, deadlines and grades. Study Sync will make it easy to identify what assignments users need to focus on first and how to navigate their academic journey up to graduation.
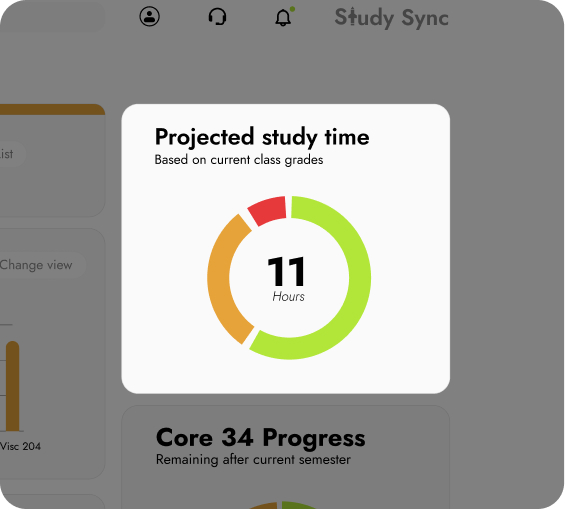
View Study Time
See projected study time based on current grades and assignments.
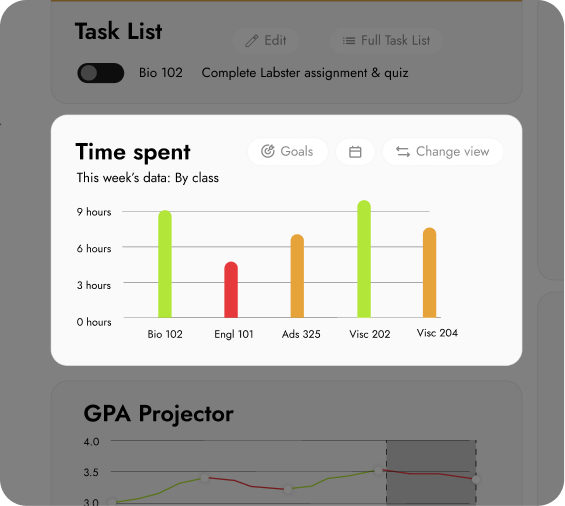
Track Time Spent
Visualize how much time you've spent studying for your classes.
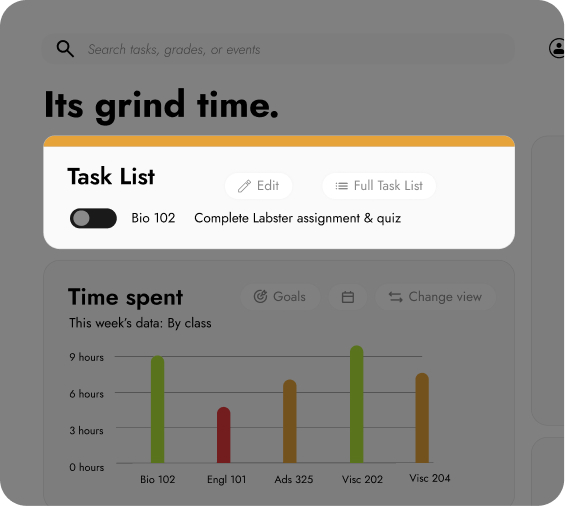
Manage Tasks
Keep users engaged with one task visible at a time, or view your full list.
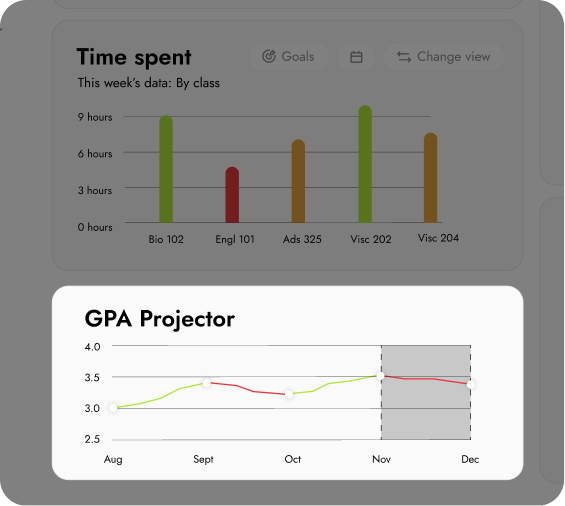
Monitor GPA
Look at your projected GPA based on weekly data.
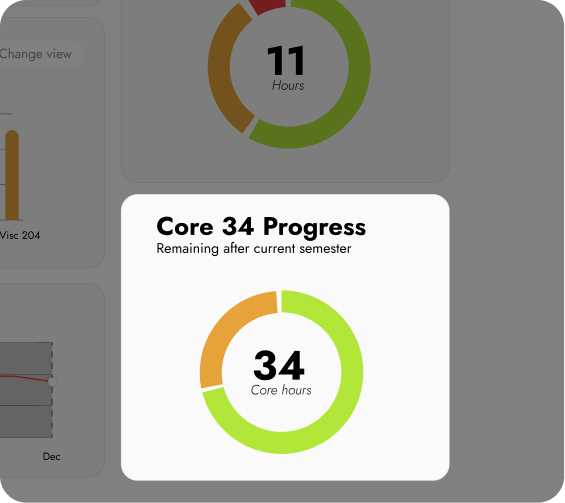
View Overall Progress
See how many classes you have left in the Core 34 graduation requirement.
Research
Overview
This dashboard gives students the ability to track progress related to school work. The dashboard will give users the ability to connect their Canvas, Blackboard, or Google Classroom account in order to input data needed for key visualizations.
Problem statement
Many college students are unable to keep up with the fast paced nature of college classes and assignments. This results in lower academic performance that may not accurately reflect the student's knowledge.
Proposed solution
Study Sync is a dashboard-based product that allows students to connect their Canvas, Blackboard, or Google Classroom to give students easy to understand information about their academics.
User Persona
Jordan Smith
Jordan needs an app that is able to organize all his classes and projects in one spot. He has ADHD and trouble forgetting assignments and their due dates. He has to stay above a 3.0 GPA to maintain his scholarship.
Because some professors use different applications, and because Canvas doesn't have a central dashboard, Jordan wants a place where he can input data and truly examine his academic success.

Jordan needs to be able to answer the following:
Theory Insights
Centralization
- One dash removes the need to check multiple apps, reducing cognitive load.
- Fewer platforms means fewer forgotten tasks.
Source: Cognitive Load Theory
Theory Insights
Progress is key
- Visual feedback reinforces motivation by showing growth and achievement clearly.
- Seeing progress reduces anxiety and helps users stay aligned with targets.
Source: Goal-Setting Theory
Theory Insights
Easier decision-making
- Graphs reveal patterns like study time vs. grades instantly.
- Visual comparisons reduce overwhelm and speed up understanding.
Source: The Visual Display of Quantitative Information
Ideation
Wireframes
At first the idea of a dashboard is simple, but once the first wireframe was made, I knew that I would have to adjust color, hierarchy and other design principles to ensure the target user group would actually benefit from this tool.


Final
Full Prototype
Adding other pages onto the dashboard, prototyping, adding key goal features.